TLDR: We’ve been developing a graph database that transforms queries into linear algebra problems, and the result is an architecture that can perform many standard operations on millions of elements in sub-second time.
Nearly two years after starting development, we reached a major milestone with the release of RedisGraph v1.0 today. RedisGraph is a graph database architecture implemented as a Redis module, using GraphBLAS sparse matrices for internal data representation and linear algebra for query execution. It is implemented purely in C, and has been tested on Linux and OS X distros. We are using Cypher as our query language, and look forward to working toward GQL with the graph database community!
In this blog, we’ll provide a quick overview of how RedisGraph uses matrix representations to solve traditional graphing problems, share some performance benchmarks, and discuss some next steps toward making our architecture as efficient and versatile as possible.
Matrices are a classic encoding format for graph data, starting with the pleasantly intuitive adjacency matrix: a square table with all nodes along each axis, and a value for each connected pair. Naively implemented, this approach scales terribly for graphs that model real-world problems, which tend to be very sparse. Space and time complexity for a matrix are governed by its dimensions (O(n²) for square matrices), making alternatives like adjacency lists more appealing for most practical applications with scaling requirements.
For RedisGraph, we’ve employed the GraphBLAS library to gain the benefits of matrix representations while optimizing for sparse data sets. (Special thanks to Tim Davis, who has worked closely with us to integrate his work as effectively as possible!)
GraphBLAS encodes matrices in compressed sparse column (CSC) form, which has a cost determined by the number of non-zero elements contained. In total, the space complexity of a matrix is:
(# of columns + 1) + (2 * # of nonzero elements)
For a dense graph, this is still bounded by O(n2), but for a complete diagonal (the identity matrix) is only 3n + 1.
This encoding is highly space-efficient, and also allows us to treat graph matrices as mathematical operands. As a result, database operations can be executed as algebraic expressions without needing to first translate data out of a form (like a series of adjacency lists).
The GraphBLAS interface allows the majority of our library invocations to be direct mathematical operations, such as matrix multiplications and transposes. These calls are evaluated lazily and optimized behind the scenes.
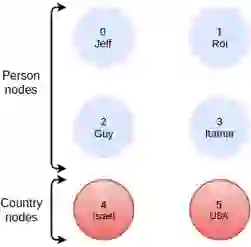
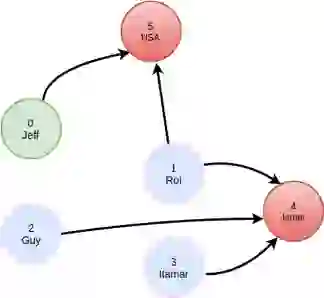
As an example, let’s take a simple graph that has 6 nodes, 4 of which have the label Person and 2 of which have the label Country:
The Cypher query we’ll run is:
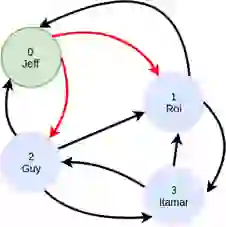
MATCH (:person {name: ‘Jeff’})-[:friend]->(:person)-[:visited]->(:country)
This will find out which countries have been visited by my friends. The query will have a filter operation to only select `person` nodes with a matching `name` property, and we will have to traverse two adjacency matrices, friend and visited.
Thanks to the minimal impact of values in the CSC encoding, our adjacency matrices always represent all node IDs. This is in contrast to representing a matrix like visited with people as rows and countries as columns. The same relationships are shown in either case, but the CSC approach allows all matrices to have the same dimensions, with row/column indices that describe the same entities., As such, we can combine any of these matrices in algebraic expressions without needing to first convert them into comparable forms.
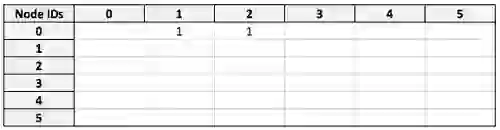
Our starting point for this query will be the `friend` adjacency matrix:
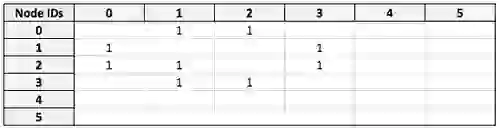
I have Node ID 0, so entries in the first row of this matrix denote the IDs of individuals I am friends with. At the moment, filters are applied node-by-node, but an optimization we’re currently developing is applying them to the matrix at this stage. This will result in a modified adjacency matrix where only my friends are represented:
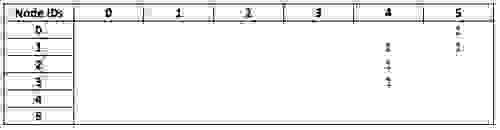
Now we take the `visited` matrix, which has the same dimensions and describes all nodes in the same order:
By multiplying the filtered `friend` matrix against `visited`, we obtain a matrix which connects my node (as a row) to the countries that my friends have visited (as columns):
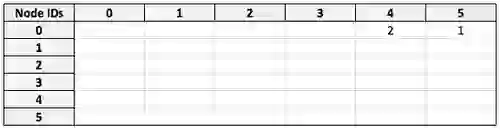
(For space optimization, we actually use boolean matrices here, so both entries would be 1 in practice.)
Testing the database’s performance on real data sets and more complex problems has yielded promising results.
All of the below values were built with the Wikipedia top categories data set on a 2016 Macbook Pro (2 GHz i5, 16gb RAM). The resulting graph contains 1,791,489 nodes and 28,511,807 edges.
Here are the performance results we achieved:
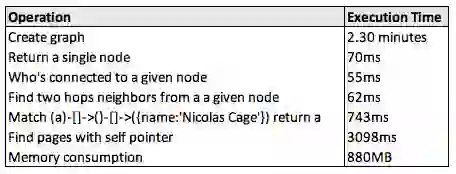
A few notes:
Our development on RedisGraph is still highly active, and the most significant tasks ahead of us are:
This is very much a wishlist, incidentally! In the spirit of Redis, RedisGraph is an open source project and contributors are always welcome. Feel free to reach out to us on GitHub if you have any comments, or if you’re interested in becoming involved.