During the 2020 wildfires in California, I, along with millions of others, have been constantly checking the PurpleAir website to monitor the air quality. In addition to looking for clean air to breathe, I was curious about how PurpleAir aggregated data from its sensors and was excited to discover that it had an API for accessing its data. It seemed a perfect opportunity to demonstrate the power of Redis as a database deployed using Kubernetes.
In the past, some of my research focused on exposing geospatial data on the web. For this project, I re-interpreted that work with two new guiding principles: (1) using Redis’ geospatial features to partition data and (2) deploying the whole application on Kubernetes. I wanted to show how DevOps challenges for managing data collection, ingestion, and querying would be easier to address with Kubernetes and the Redis Enterprise operator for Kubernetes.
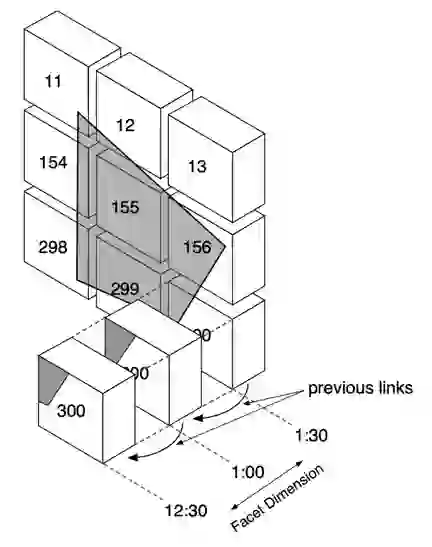
I chose to use a methodology from my dissertation research called PAN (Partition, Annotate, and Name) to produce data partitions organized by inherent facets (e.g., date/time, geospatial coordinates, etc.). Redis provides the perfect building blocks for applying this methodology to the air-quality sensor data collected by PurpleAir. The technique I use maps a geospatial area of interest (the shaded polygon) onto data partitions (the boxes). You can then retrieve and navigate these partitions via their metadata, and you can select partitions over whichever timespan you’re interested in.
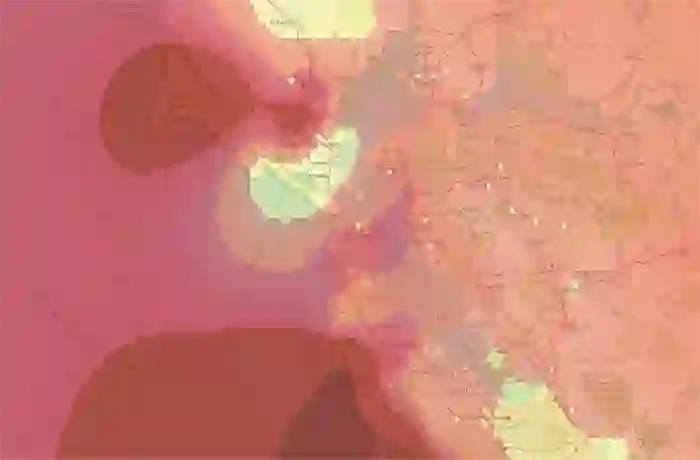
I was able to quickly produce a working application that collects the data and provides simple interpolation of AQI (Air Quality Index) measurements across a color-coded map. This image was generated using sensor data from August 28, 2020:
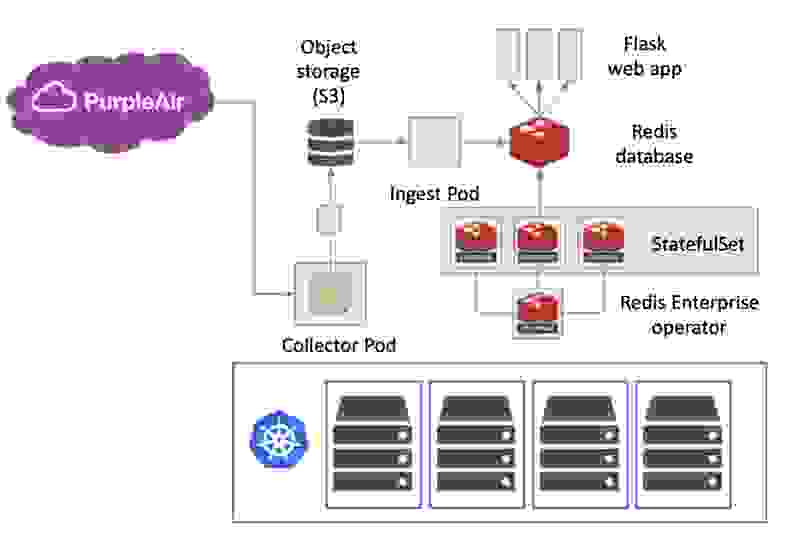
Taking this further required making all of the pieces operational in a reliable way, and that’s where Kubernetes became essential. Kubernetes made it easy to describe and deploy the data collection, ingestion, Redis database, and the web application as independently scalable components manageable by the cluster:
I was invited to speak about this application for the Data on Kubernetes community meetup. I presented some of my past research into scientific data representation on the web and how the key mechanism is the partitioning, annotation, and naming of data representations. I showed how I implemented this for collecting, storing, and using air quality data via Python, Redis, and a Kubernetes deployment. You can watch my full presentation and learn more in the video and podcast embedded below (and see my presentation slides here).