


How to Use the New Redis Data Source for Grafana Plug-in
Learn more


Grafana is a well-known and widely used open source application monitoring tool. And now, thanks to the new Redis Data Source for Grafana plug-in, it works with Redis!
With this new capability, DevOps practitioners and database admins can use a tool they are already familiar with to easily create dashboards to monitor their Redis databases and application data. The new Grafana Redis Data Source plug-in allows you to visualize RedisTimeSeries data and core Redis data types like Strings, Hashes, Sets, and more. Also, it can parse and display the output of Redis admin commands, such as SLOWLOG GET, INFO, and CLIENT LIST.

Don’t miss the other blogs in this series: How to Use the New Redis Data Source for Grafana Plug-in and 3 Real-Life Apps Built with Redis Data Source for Grafana
The new Redis Data Source for Grafana can connect to any Redis database—including open source Redis, Redis Enterprise, Redis Enterprise Cloud—and works with Grafana 7.0 and later. If you already have Grafana 7.0, you can install the Data Source plug-in with this grafana-cli command:
grafana-cli plugins install redis-datasource
If you don’t have Grafana installed, or just want to try the new data source, you can easily get started with Grafana in a Docker container:
docker run -d -p 3000:3000 --name=grafana -e "GF_INSTALL_PLUGINS=redis-datasource" grafana/grafana
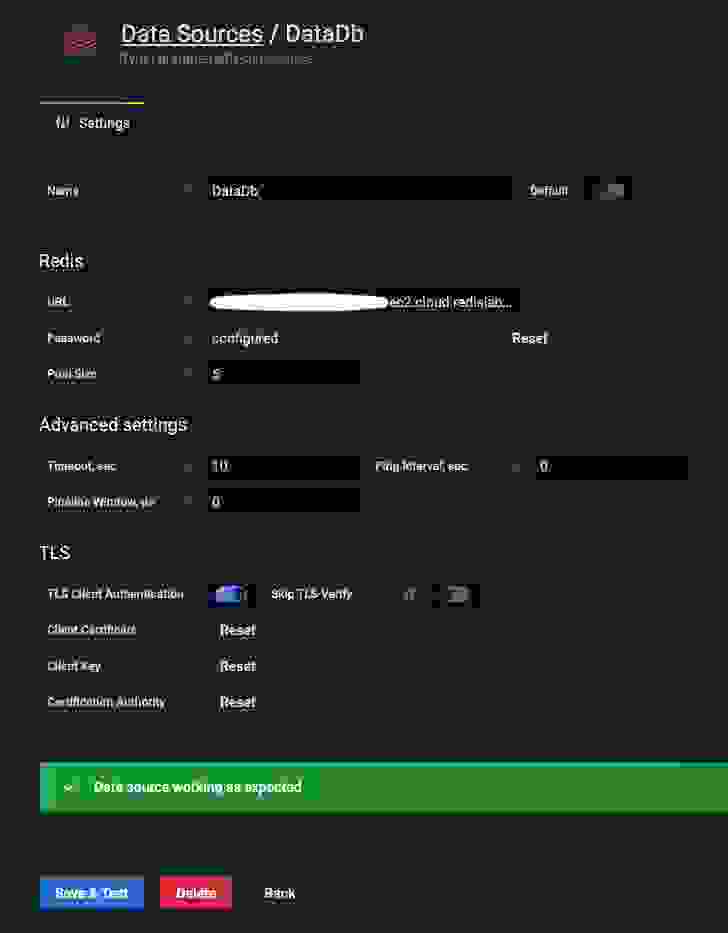
Setting up Redis Data Source for Grafana is just as easy as working with any other Grafana data source. There are additional configuration options available, besides the server address and port, including database password and Transport Layer Security (TLS) connection.
After you complete the initial configuration, you can start to create panels displaying Redis data! The Redis Data Source plug-in supports three different command types: Redis commands, RedisTimeSeries commands, and universal inputs.
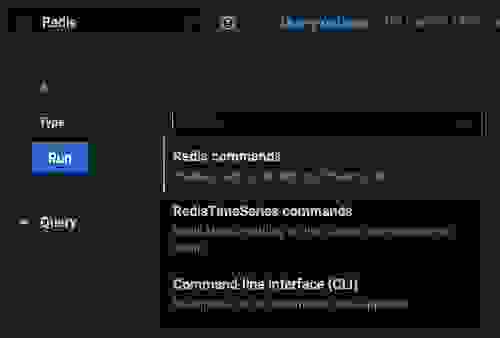
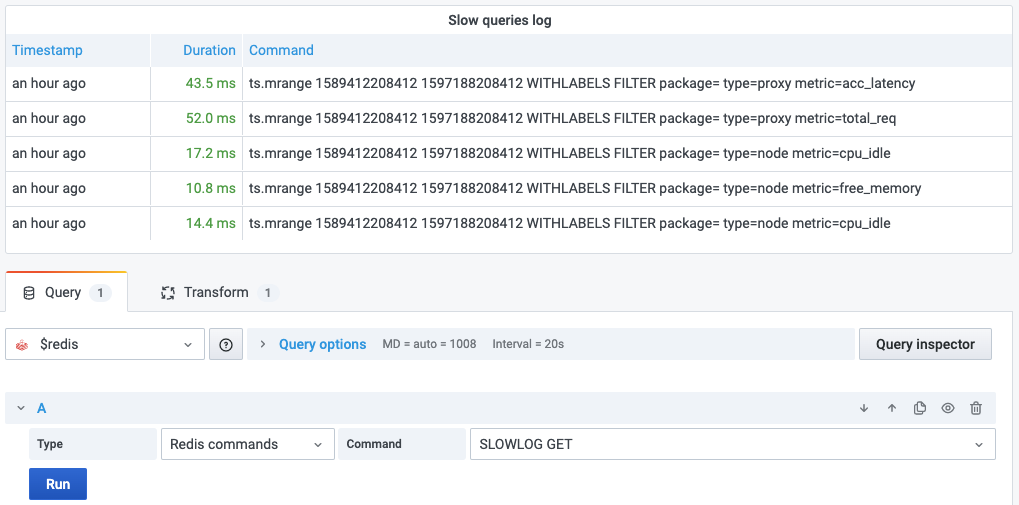
1. Redis commands comprise a number of predefined commands to retrieve core Redis data types, such as Hashes, Sets, Strings, Streams, etc. The command’s output is pre-formatted for easy use in the Grafana interface. This mode also allows you to execute Redis admin commands: SLOWLOG GET, INFO, CLIENT LIST. Their output comes in newly introduced data frames, so you can apply Grafana transformations to modify the standard output.
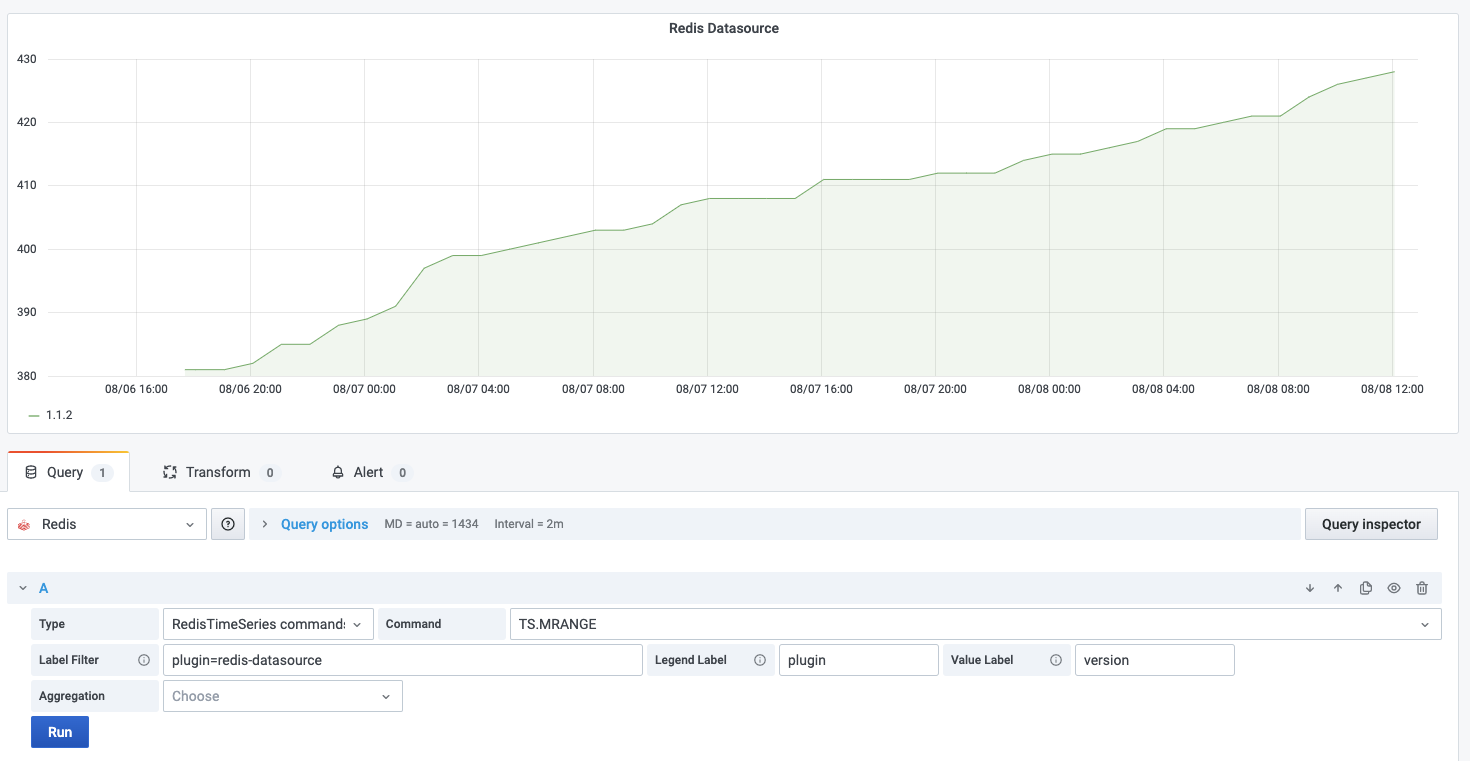
2. RedisTimeSeries commands offer an interface to let you work with the RedisTimeSeries module. Currently, it supports two commands: TS.RANGE and TS.MRANGE, which let you query a range from one or more time series. The example below shows the number of downloads of the Redis Data Source from the Grafana repository.
3. Universal input allows you to use other commands, not supported by the first two modes. Please keep in mind that:
To get started, install the Redis Monitoring Dashboard, built for the new Grafana Data Source, and play with it.
The monitoring dashboard uses various sections of the INFO command with the relevant Grafana transformation. Additionally, it has a SLOWLOG panel, so you can quickly identify your slowest queries (which can impact the performance of your Redis database), and a CLIENT LIST panel displaying the information about client connections.
There are endless possibilities to use the new Redis Data Source Plug-in for Grafana; we plan to share more example dashboards, including a fun application for weather geeks, in the coming weeks. So please stay tuned!